
Dunwoody residents generally are happy with their city, the services it provides and its quality of life, according to a 2015 community survey. But they remain unhappy with traffic and want more streets paved, according to that same survey.
At the March 14 City Council meeting, Communications Director Bob Mullen presented the 2015 survey, noting that overall, residents say they are happy with the quality of life in Dunwoody and happier with the actions of city government than they were two years ago, when the city conducted its first such survey.
“Overall, we received very positive results,” Mullen said.
Traffic continues to weigh heavily on residents’ minds. In 2013, 70 percent of respondents said traffic was the city’s top weakness; in 2015 that number reached 83 percent.
The condition of streets and infrastructure also ranked as a major weakness. In 2013, 38 percent of the respondents identified road conditions as the city’s top weakness; in 2015, the number was 56 percent.
The surveys were developed by the city and its research partner, Pioneer Marketing. Invitations to participate in the survey were sent to 5,000 random households to complete the survey online. There were 415 online surveys completed for an 8.4 percent return rate which is above average for community surveys using a similar mail methodology, Mullen said. The survey also included one-on-one phone calls with 47 individuals, Mullen said.
“Our goal is to listen to our residents and try to respond to their needs. By conducting this survey, the city not only collects important data and feedback but also leverages the input received in order to help address priorities, pinpoint issues and improve upon what we are providing,” said Dunwoody Mayor Denis Shortal in a statement.
Some findings of the 2015 survey:
■ The top weaknesses for the city in 2015 are traffic, streets and infrastructure.
■ When asked to name the biggest issue facing Dunwoody, traffic ranked 19 percent in 2013 and rocketed to 43 percent in 2015.
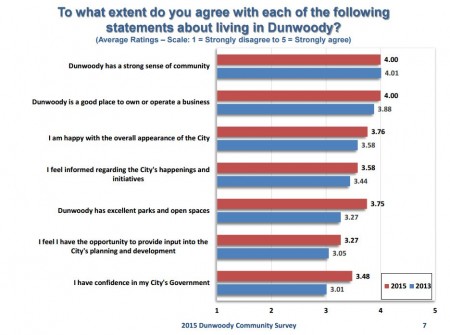
■ On a scale of 1 to 5, with 1 being “very dissatisfied” and 5 being “very satisfied,” the phrase “I have confidence in my city’s government” rated an average of 3.01 out of 5 in 2013; in 2015 that number increased to 3.48 of 5.
■ In 2013, 24 percent of respondents said “citizens not welcoming change/division of citizens/conflicting views of nature” was the city’s biggest issue; in 2015, that percentage dropped to 5 percent.
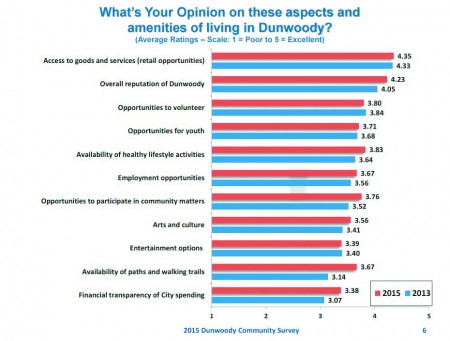
■ When asked how important it is to have arts, culture and creative offerings in Dunwoody, 47 percent of respondents answered “very important” while 3 percent said “not at all important.”
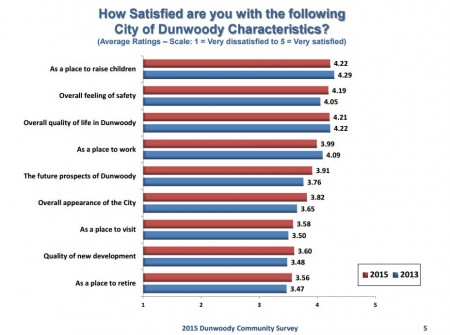
The survey also found the city’s police department continues to rank high in resident satisfaction. The department received a 4.29 of 5 positive ranking in 2015, slightly up from a 4.27 of 5 ranking in 2013. For an overall feeling of safety, the ranking was 4.19 of 5 in 2015, up from the 4.05 score in 2013.
Other areas the police department continues to score well: overall performance is at 4.34 for 2015 and was 4.33 in 2013; visibility in the community is at 4.25 in 2015 and was 4.29 in 2013; quality of personnel ranks 4.28 for both years; community interaction stays about the same at 4.19 in 2015 and 4.14 in 2013; and traffic control also stays the same rate at 4.06 for both years.
Also, 67 percent of respondents said they believe Dunwoody is a safe community; in 2013 that number was 68 percent.
Residents’ feelings about Dunwoody’s city government also improved, with a 3.59 of 5 ranking in 2015, up from a 3.14 in 2013. Confidence in city government soared from 3.01 of 5 in 2013 to 3.48 of 5 in 2015. City Council also scored well, with a 3.54 of 5 ranking for doing a good job of handling the city’s finances in 2015 compared to a 3.08 of 5 score in 2013, and a jump to 3.41 of 5 in 2015 to being responsive to the community compared to 3.00 of 5 in 2013.
Residents rated the city’s location as one of its appeals, with 86 percent rating location as a “top strength” in 2015, a slight dip from 89 percent in 2013.
Parks and recreation also continues to score well, with quality of playgrounds ranking 4.03 of 5 in 2015 compared to 3.68 of 5 in 2013; overall quality of city parks in 2015 scored 3.99 of 5, a jump from 2013’s score of 3.38 of 5; quality of trails and open spaces also improved significantly, going from 3.38 of 5 in 2013 to 3.99 of 5 in 2015.
Several categories considered “top strengths” of Dunwoody dropped this year when compared to the 2013 survey. The percentage who said the city’s lifestyle and entertainment was a strength fell from 39 percent in 2013 to 26 percent in 2015. The percentage who called education a strength dropped from 36 percent to 25 percent.
City Councilman John Heneghan said while it was nice “we are all patting ourselves on the back,” it is important to realize that many of the high points of the survey were due to local nonprofits that manage events like the Dunwoody Arts Festival, the Dunwoody Nature Center and Food Truck Thursdays.
“These are not due to the city. And we need to support them and foster them,” he said.
Councilwoman Lynn Deutsch asked if it was possible to also have a community survey conducted online, similar to a parks survey, but she was told doing so takes out the scientific random samples needed to ensure quality data. Sometimes people can organize and drive answers to what they want, for example.
“I’m thrilled with the results,” said Councilman Doug Thompson. “Even the city council scored higher.”